Custom Table
There three types of custom table: Fixed, Iterative, and From View.
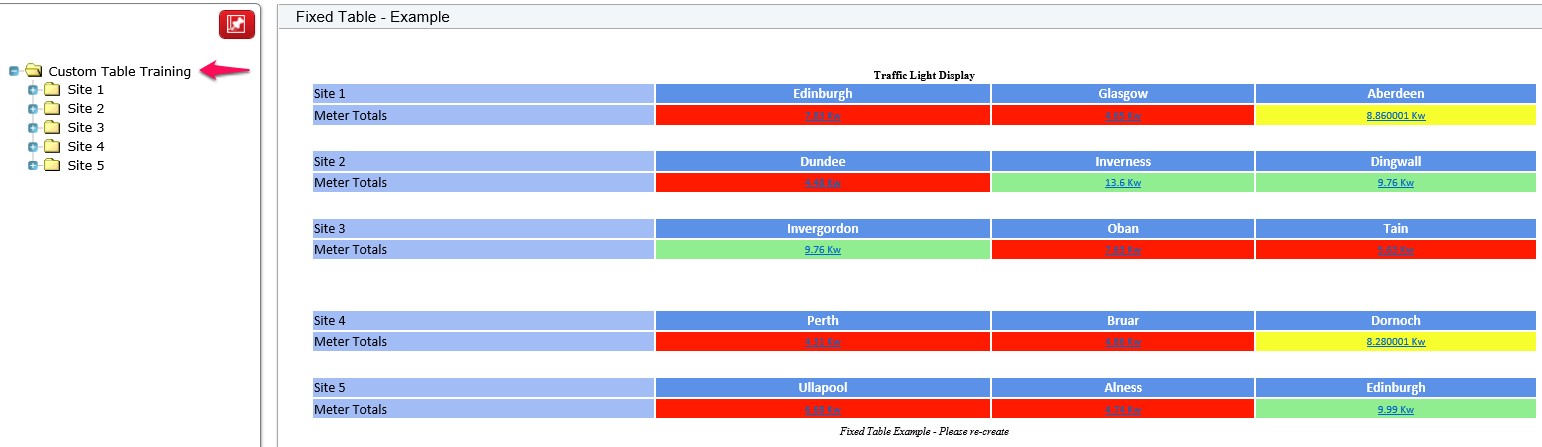
Fixed
A fixed table is a design that is usually based on one container/site and renders data from that container.
A user may set up a fixed table to show information from a selected project such as project code, name, cost, etc.
This table matches points on their name and will only show a fixed number of rows.
Each cell in the grid is configured to display text, point, or property value.
When linking to a point, it is a one-to-one match.
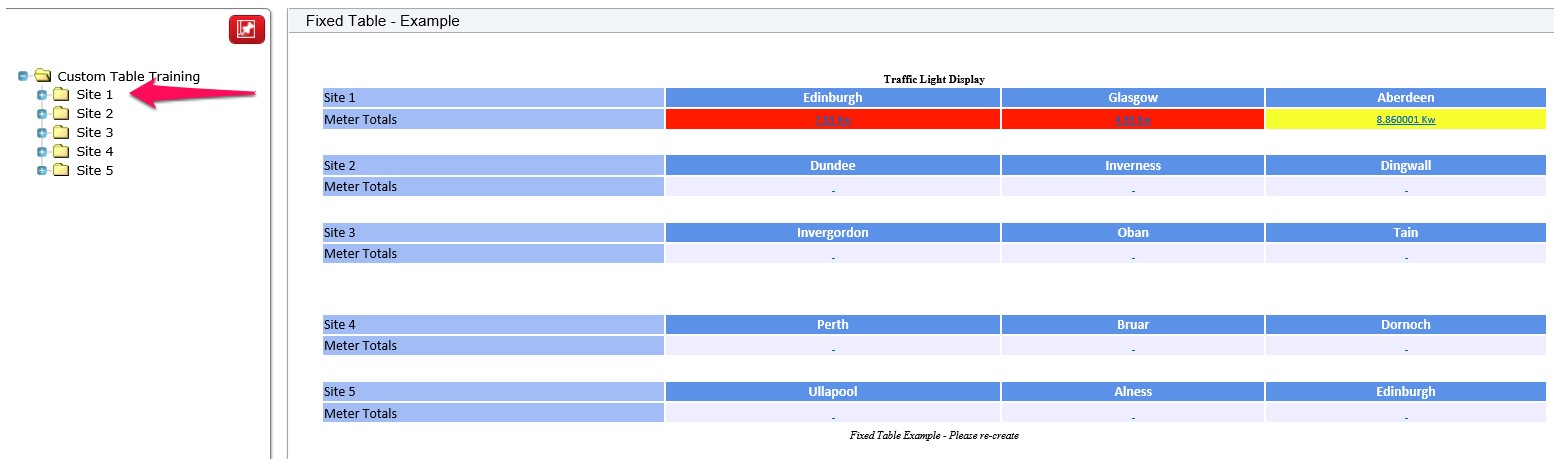
This table takes into account what has been selected on the tree view on the left hand side.
In this example, the table has been configured to display data from points from all the 5 sites.
The table will display data for a point if it is within the container that has been selected in the TreeView.
If the user clicks on Custom Table Training, then all points configured in the table are within here, so all the data is displayed.
If the user then clicks on Site 1, then only data from points that are directly within this container will be displayed. This gives us a reduced view.
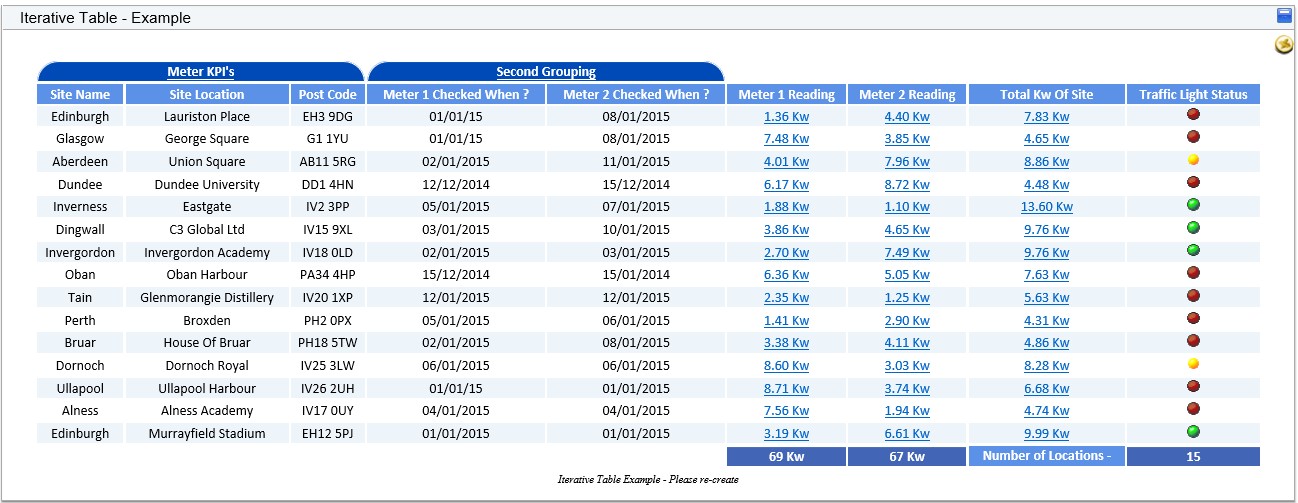
Iterative
An iterative table is more of a reporting table with headings, details, grouping/sub-totals and a footer/totals row. The containers are iterated through and a detail row is rendered for each container/row. Therefore, an iterative table is not of a fixed size and it is undeterminable at the time of design how big the table will be.
This would be used where a more general report layout is required. So an iterative table iterating by level 3 (i.e., the level at which the project containers are located) might be designed to report on project costs (e.g., Project number, name, manager, and cost might be shown on the report table).
This table will show all points that match the configured criteria but must exist within the same level. The amount of rows in this table will vary depending on how many points match the criteria.
From View
This is similar to the Iterative table, with the difference being how it gets the data.
The ‘From View’ and ‘From View (Sorted)’ table types allow a report table to be based on the rows returned by a view in the 4D Analytics Database. The data returned in this view doesn’t, however, have to be from the 4D Analytics database.
When using either ‘From View’ table type, the report table does not rely on the 4D Analytics database in any way. This means that the options to add property/point data to the report table are not available. Only data from the view columns can be added to the table.
As these table types are not reliant on 4D Analytics, the Container/Site Ident Column on the table settings can be left as ‘Not Required’. If a container/site id column is selected off the view however, then the data from the view will be restricted to those rows with a container ident matching the one passed across on the URL when rendering the widget/report.
Reports based on date ranges can also be configured by selecting the Date Column off the view.